AHDB’s 2018 Planting and Variety Survey of 6,832 farms also showed a continued trend for declining GB wheat area, but an increase in the area of spring barley.
The key findings of the survey are:
- GB wheat area is estimated at 1.74 million hectares (Mha), a 2% decrease from 2017
- GB spring barley area is estimated at 768 thousand hectares (Kha), up 4% from 2017
- GB winter barley area is estimated at 385Kha, 7% lower than 2017
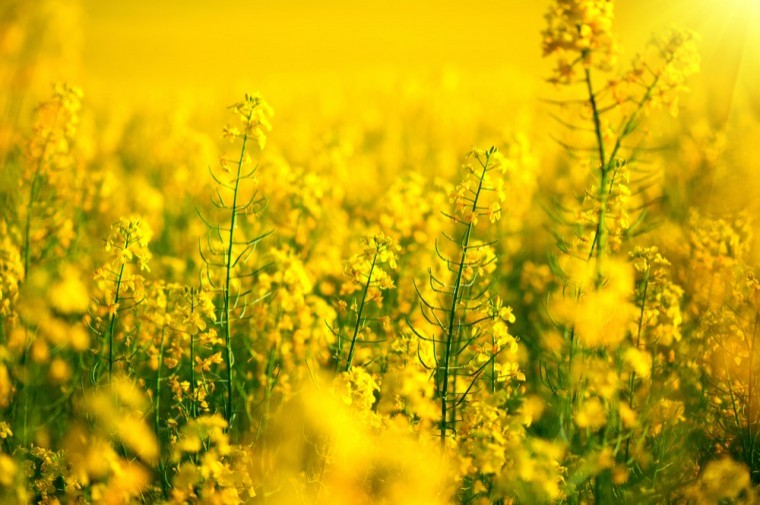
- Area of oilseed rape in England and Scotland is estimated at 608Kha, up 9% from 2017
- Area of oats in England and Scotland is estimated at 156Kha, a 2% increase from 2017
Peter Collier, AHDB analyst, said: “The oilseed rape area, while showing a significant increase year on year, is still low in comparison to recent history. The increased area for 2018 is arguably a reflection on how poor planting conditions were for harvest 2017.
“The continued trend for a declining GB wheat area, combined with lower stocks and the current dry conditions could leave the 2018/19 domestic supply tight once more.”
Oilseed rape
The oilseed rape area in England and Scotland has risen for the first time in seven years to an estimated 608Kha. However, the area is still well below the 2015 area and is still 19% (143Kha) lower than the record set in 2012.
The year-on-year increase in planted area is likely a reflection of the better planting conditions for oilseed rape in autumn 2017, following the previous season’s prohibitively dry autumn conditions and cabbage stem flea beetle impact. The significant area increases are in the Eastern and South East English regions, which recorded particularly sharp declines in 2017.
Due to a low Welsh survey response rate for oilseed rape, AHDB is unable to provide an area for Wales and therefore, a GB area. However, across the previous five years, Wales has represented less than 1% of the GB oilseed rape area.
Elgar, a variety recommended for the East and West regions in 2018, continues to represent the largest proportion of the oilseed rape area, rising to 14% of the English and Scottish area. At 9 per cent, Campus accounts for the second highest area, followed by DK Extrovert, with 8 per cent.
Wheat
At 1.74Mha, the 2018 GB wheat area is estimated 2% lower than in 2017.
The largest wheat area reductions are in the Eastern region and the South East and London, where black-grass remains a key challenge. For harvest 2018, the declining wheat area in the Eastern region has seemingly been replaced by oilseed rape rather than spring barley, as in previous years.
Yields will need to be above the five-year average for domestic wheat supply to increase in 2018/19. This is because the 2017/18 wheat end-season stocks are estimated to be the lowest since 2013/14 and the GB wheat area continues to decline into 2018.
Given the current dry conditions, and the potential impact on yields if continued, this will be unlikely. AHDB will be looking at supply and demand in more detail and producing production scenarios later this summer. These will be published on the AHDB website.
In terms of varieties, nabim Group 1 and 2 varieties are estimated to account for 38% of the 2018 GB wheat area, slightly down from 40 per cent in 2017. Regionally, the Eastern area of Group 1 and 2 represents 110kha and 65kha respectively, and the South East and London 103Kha and 19Kha. These two regions represent just under half of the nabim Group 1 and 2 area.
In 2018, the nabim Group 3 varieties account for 8% of the GB wheat area, up from 5% in 2017, a 50Kha rise. Following the introduction of higher-yielding Group 3 varieties, such as KWS Barrel and Basset, which were added to the recommended list in 2016/17, there has been a notable increase in the 2018 Group 3 area.
The nabim Group 4 area change is split between Hard and Soft. The Group 4 Hard area for GB as a whole remains unchanged. Meanwhile, the Group 4 Soft area has seen a 9% reduction, mainly driven by a 27% reduction in Scotland, seemingly replaced by the Group 3 wheats.
Barley
Overall the GB barley area in 2018 remains unchanged year on year. However, with lower yielding spring barley accounting for a greater percentage of the total, yields will need to be above average to maintain production levels. Given the current dry conditions, this will be challenging. Furthermore, given that forage availability is tight, there is a possibility that not all crops will be harvested for grain.
The GB winter barley area has undergone a significant reduction for harvest 2018. At 385Kha, the area reported is down 7% from 2017, a reduction of 31Kha year on year. In Scotland, the reduction in winter barley to 39Kha will be the lowest area this millennium.
At 768Kha, the GB spring barley area is estimated to be 4 per cent higher than in 2017, the fourth year in a row that the spring barley area has expanded. The increase is primarily driven by an area expansion in Scotland, the North West and Yorkshire. This suggests that spring barley was a necessary planting decision in areas unable to plant winter cropping options for 2018, combined with a lower cost of production than winter barley.
Overall, malting barley varieties with full approval from the Institute of Brewing and Distilling for harvest 2018 account for 57% of the total GB barley area. This is up from 2017, when malting barley varieties accounted for 50% of GB area. However, the figures only include varieties with full approval. Due in part to the full approval of Laureate for 2018, the area suitable for maltsters may not have risen by the same extent.
Oats
At a combined 156Kha, the total oat area across England and Scotland is up 2% from 2017. At 32Kha, the Scottish area represents a 1% decline from 2017, driven by a decline in winter oats, which is not fully compensated by a rise in spring oats. The English area at 124Kha is a 3% increase from 2017, driven predominantly by a 4kha rise in the South West.
The oat area is relatively small in comparison to that of other crops, so estimations should be treated with additional caution.
Due to a low Welsh survey response rate for oats, the AHDB is unable to provide an area for Wales and therefore GB. In the previous five years, Wales has represented a maximum of 4% of the GB oat area.


